Sales & Sales Dashboard · 16 October 2026 · 6 min read
How to Record Daily Sales So the Data Is Actually Useful
A five-minute daily sales format, how to work out average basket size and your best seller, and a weekly recap that leads to real decisions.

If your sales record is a single daily total, you are losing almost all of its value. What makes the record useful is the detail: which product, how many, at what hour, through which channel.
1. The columns you need
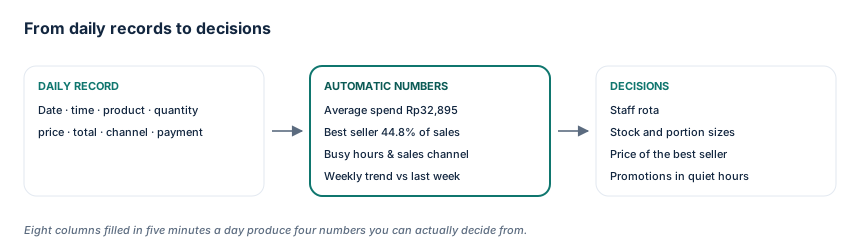
Date · time · product · quantity · unit price · total · channel (walk-in / online / marketplace) · payment method (cash / QRIS / transfer).
| Date | Time | Product | Qty | Price | Total | Payment |
|---|---|---|---|---|---|---|
| 16/10 | 08:15 | Milk coffee | 1 | 25,500 | 25,500 | QRIS |
| 16/10 | 12:40 | Chicken rice | 2 | 25,000 | 50,000 | Cash |
| 16/10 | 19:05 | Milk coffee | 3 | 25,500 | 76,500 | QRIS |
Those eight columns are enough. You do not need an expensive till system: a spreadsheet on your phone can be filled in between customers.
2. Four numbers that pay off immediately
From the daily record, work out:
- Average spend per transaction. For example: Rp1,250,000 in a day from 38 transactions → Rp32,895 each, rounded to Rp32,900. When this rises, customers are buying more or your bundles are working.
- Best seller by value, not just by quantity. Milk coffee contributing Rp560,000 out of Rp1,250,000 is 44.8% of sales — that is the product most exposed when bean prices move, not the cheap item you sell most often.
- Busy hours. This is what you roster staff and stock from.
- Channel and payment method. Useful for judging QRIS or marketplace fees and for knowing what actually reaches your bank account.
3. Weekly and monthly recaps
With a daily average of Rp1,250,000 the week is about Rp8,750,000 and a 30-day month about Rp37,500,000. Only comparisons make these figures useful — this week against last week, this month against last month. When it drops, look for the cause in the detail: a product lost its buyers, the busy hours shifted, or the online channel went quiet.
4. Habits that keep it going
- Record at the moment of sale, not at closing. Five minutes a day beats two hours of remembering at the weekend.
- Keep it on your phone in something that syncs automatically (Google Sheets), with one extra column for notes ("heavy rain in the afternoon").
- Fix one weekly slot (Saturday morning, 20 minutes) to read the recap.
- Never delete a wrong row: correct it. The history is what keeps the comparisons valid.
5. Mistakes that happen often
- Recording the daily total only, so you never learn which product really earns.
- Recording sales but not discounts and cancelled orders.
- Mixing unpaid orders into finished sales — that makes cash flow look better than it is.
Our Sales Dashboard Template already lays out the columns above and calculates average spend, best sellers and weekly trends automatically from your daily entries.
The kit for this topic
Sales & Dashboard Template
Rp99.000 (≈ USD 6)
Record daily sales, see the monthly recap, and read your sales trend and best sellers on one short page.